Behind the Tokenization League Table
What growth velocity, growth shape, and peer reordering reveal about the future of tokenized markets
When people compare blockchains for real-world asset tokenization - the business of putting traditional financial assets like Treasuries, money market funds, and corporate bonds on-chain - they almost always start with one number: which network has the most of it today.
By that scoreboard, Ethereum wins. It hosts roughly 55% of all tokenized assets, and that’s where most public commentary stops.
It’s a fair snapshot. It’s also the wrong way to understand where the market is going.
If you wanted to know which restaurant in town was becoming the place to eat, you wouldn’t just count how many tables are full tonight. You’d want to know who’s walking in this month, which chefs are choosing to cook there, and whether the bookings are accelerating. Current size tells you about the past. Growth and momentum tell you about the future.
That’s the lens this report uses. And under that lens, a different story emerges. XRP, the world’s 5th-largest crypto asset by market capitalization, ranks #11 by current tokenized asset value in the dataset we analyzed. That gap, between the network’s standing in the broader market and its current share of tokenization activity, is itself part of the signal. Under the lens of growth rather than current size, XRP sits in the top tier across nearly every measure we ran.
Why is this activity choosing XRP? Our belief: the network was designed around the operating requirements of financial markets rather than retrofitted for them: 24/7 settlement, transaction finality in 3–5 seconds, costs measured in fractions of a cent, and a native asset-issuance and compliance layer. These are the types of baseline conditions for regulated financial activity moving onto public infrastructure, which is the practical reason a network like this could become a platform institutions rely on.
Here’s what the data shows.
Disclosure: Evernorth is a digital asset treasury company that holds XRP. This analysis should be read with that interest in mind.
WHAT WE LOOKED AT
We used the full time-series export from rwa.xyz, a standard industry source for tracking real-world assets on-chain. The metric is "Bridged Token Value (Dollar),” essentially the dollar value of tokenized financial assets issued on each network. The data covers 29 networks from September 2018 through May 19, 2026.
A few baseline numbers, as of May 19:
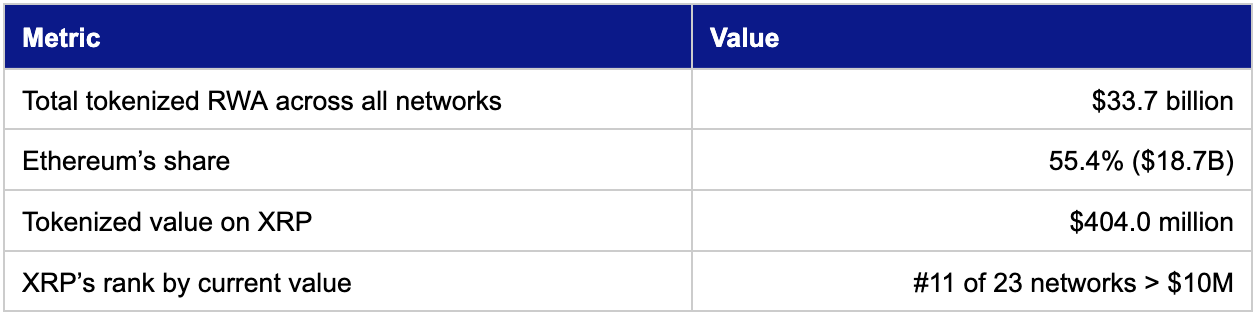
By size alone, the story usually ends here. But there are five other patterns in the dataset that change the read.
FINDING 1
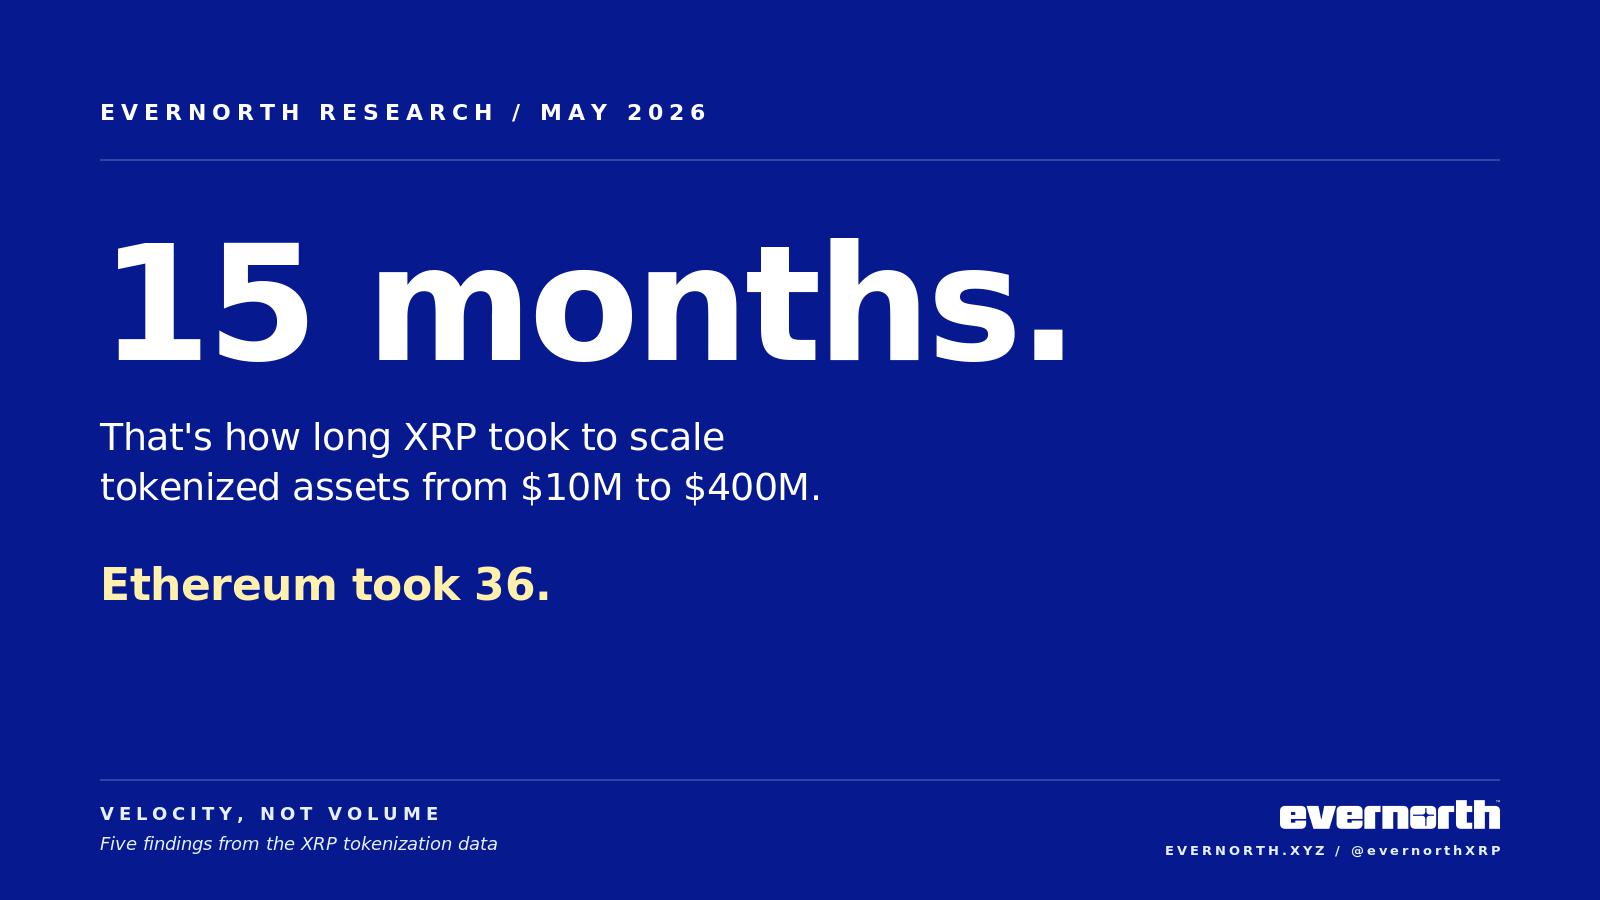
XRP hit $400M in 15 months. Ethereum took 36.
The fairest way to compare networks from different eras is to ask each the same question: how long did it take you to grow to a comparable value? In this case, we assessed the time it took to grow from $10 million to $400 million in tokenized value. That helps to filter out the advantage of having started years earlier and shows scaling speed.
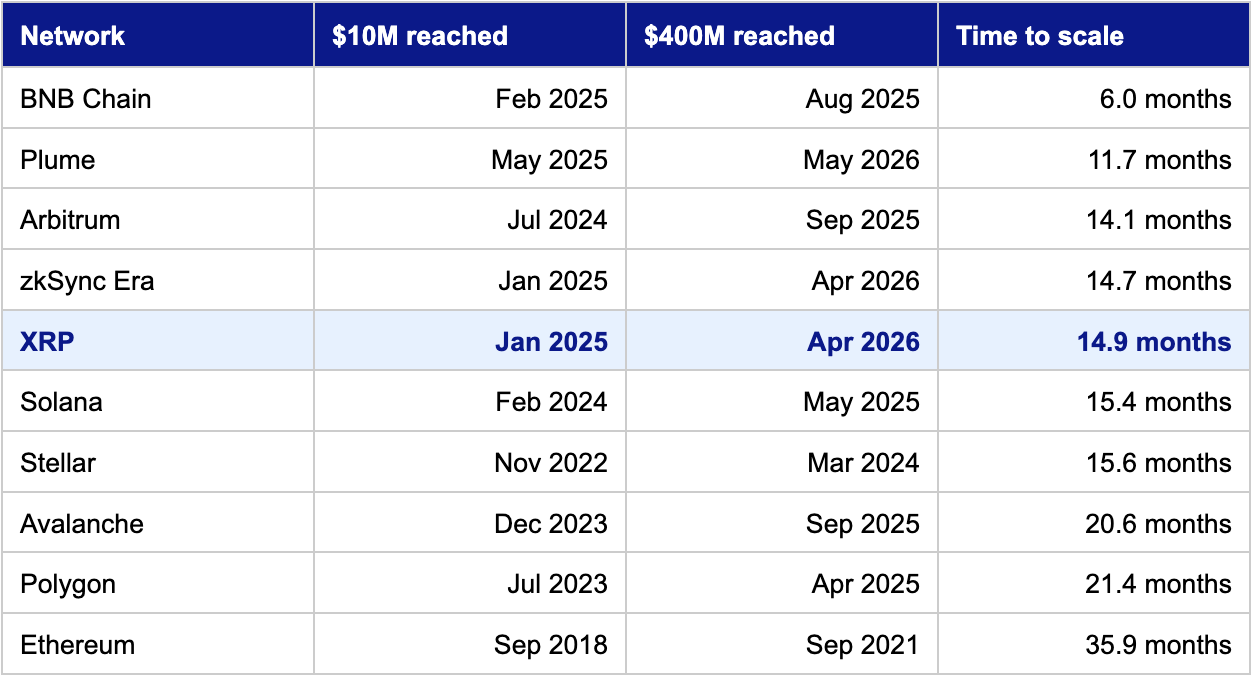
XRP covered the same ground in 15 months that Ethereum took 36 months to cover. It moved faster than Avalanche by six months, faster than Polygon by seven. It’s effectively tied with Solana, Arbitrum, and zkSync Era, the chains most builders consider today’s frontier of tokenization.
The two networks that scaled even faster (BNB Chain and Plume) each had unusual circumstances. BNB Chain’s curve was driven almost entirely by a single concentrated asset; Plume launched into a market where the tokenization playbook was already established. XRP had neither advantage. It scaled at frontier speed from a standing start.
The point: current size tells you who got here first. Time-to-scale tells you whether a network can absorb new issuance fast enough to keep growing.
FINDING 2
XRP is growing faster than Ethereum this year — by more than 2x
Looking at year-to-date growth in 2026, among the 14 networks with more than $200M in tokenized assets today:
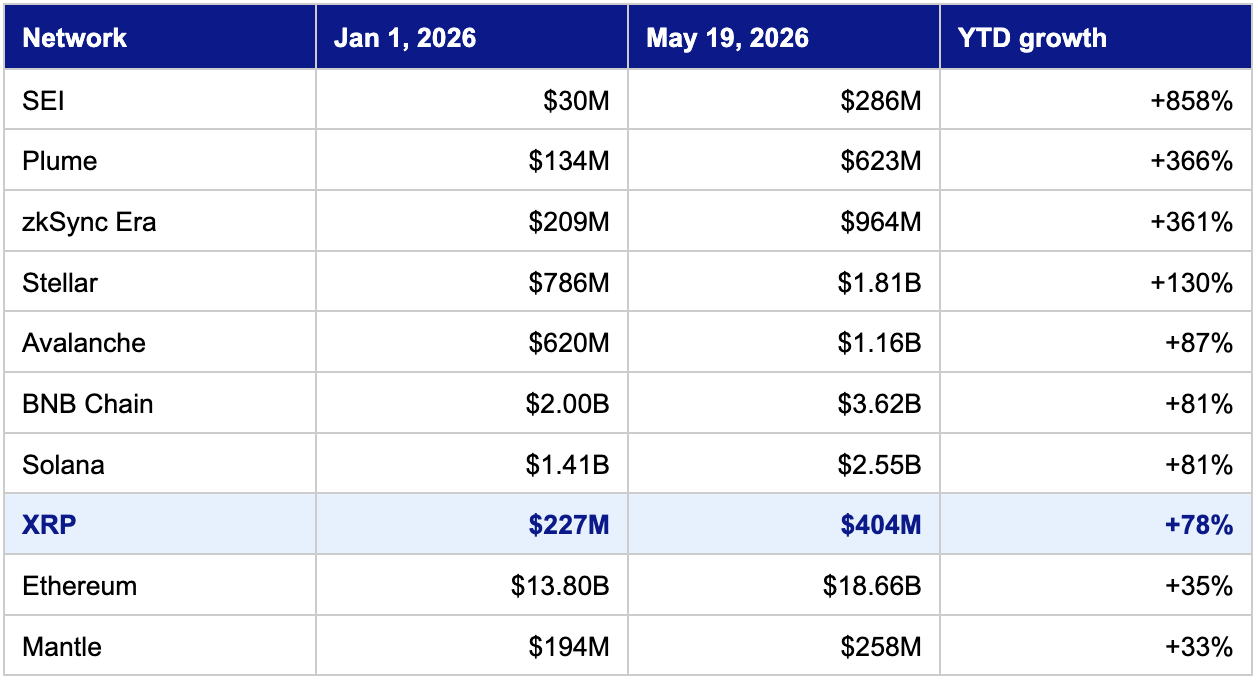
The three networks growing faster than XRP (SEI, Plume, zkSync) are all starting from much smaller bases (i.e. when you’re tiny, percentages are easier). The more useful comparison is to the established networks: Stellar, Avalanche, BNB Chain, Solana. XRP is right in that bracket.
And then there’s the comparison that matters most. Ethereum hosts more than half of all tokenized assets on the planet, and it’s growing at +35% this year. XRP is growing more than twice as fast.
If sustained over multiple quarters, that kind of gap is how rankings actually change.. It doesn’t guarantee XRP passes Ethereum. It does mean today’s rankings reflect yesterday’s market, not the trajectory of where the new capital is being deployed.
FINDING 3
XRP’s growth comes from a few big institutional commitments, not a steady drip
Two networks can grow by the same total amount in a year, but the shape of how they got there tells you a lot about who’s actually using them.
Think of it like a restaurant comparison. One restaurant might do $1M in revenue this year because thousands of regular customers come in every day for lunch. Another might do the same $1M because a handful of large corporate accounts booked big catering jobs. Same total but with different business models and different futures.
For tokenization networks, we can measure this directly: what share of a network’s growth this year came from its biggest inflow days?
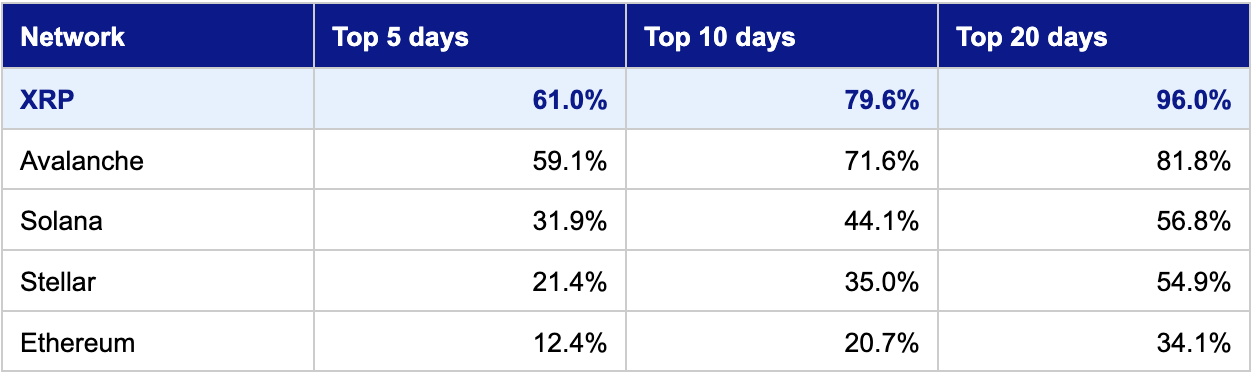
Read XRP’s row carefully. Of the past 365 days, just 20 of them produced 96% of all the new tokenization activity on the network. The other 345 days, taken together, contributed 4%.
Ethereum is the opposite picture. Its biggest 20 days produced only about a third of its annual growth because Ethereum’s tokenization activity is spread across hundreds of small contributions every week.
The visual makes the difference clear:
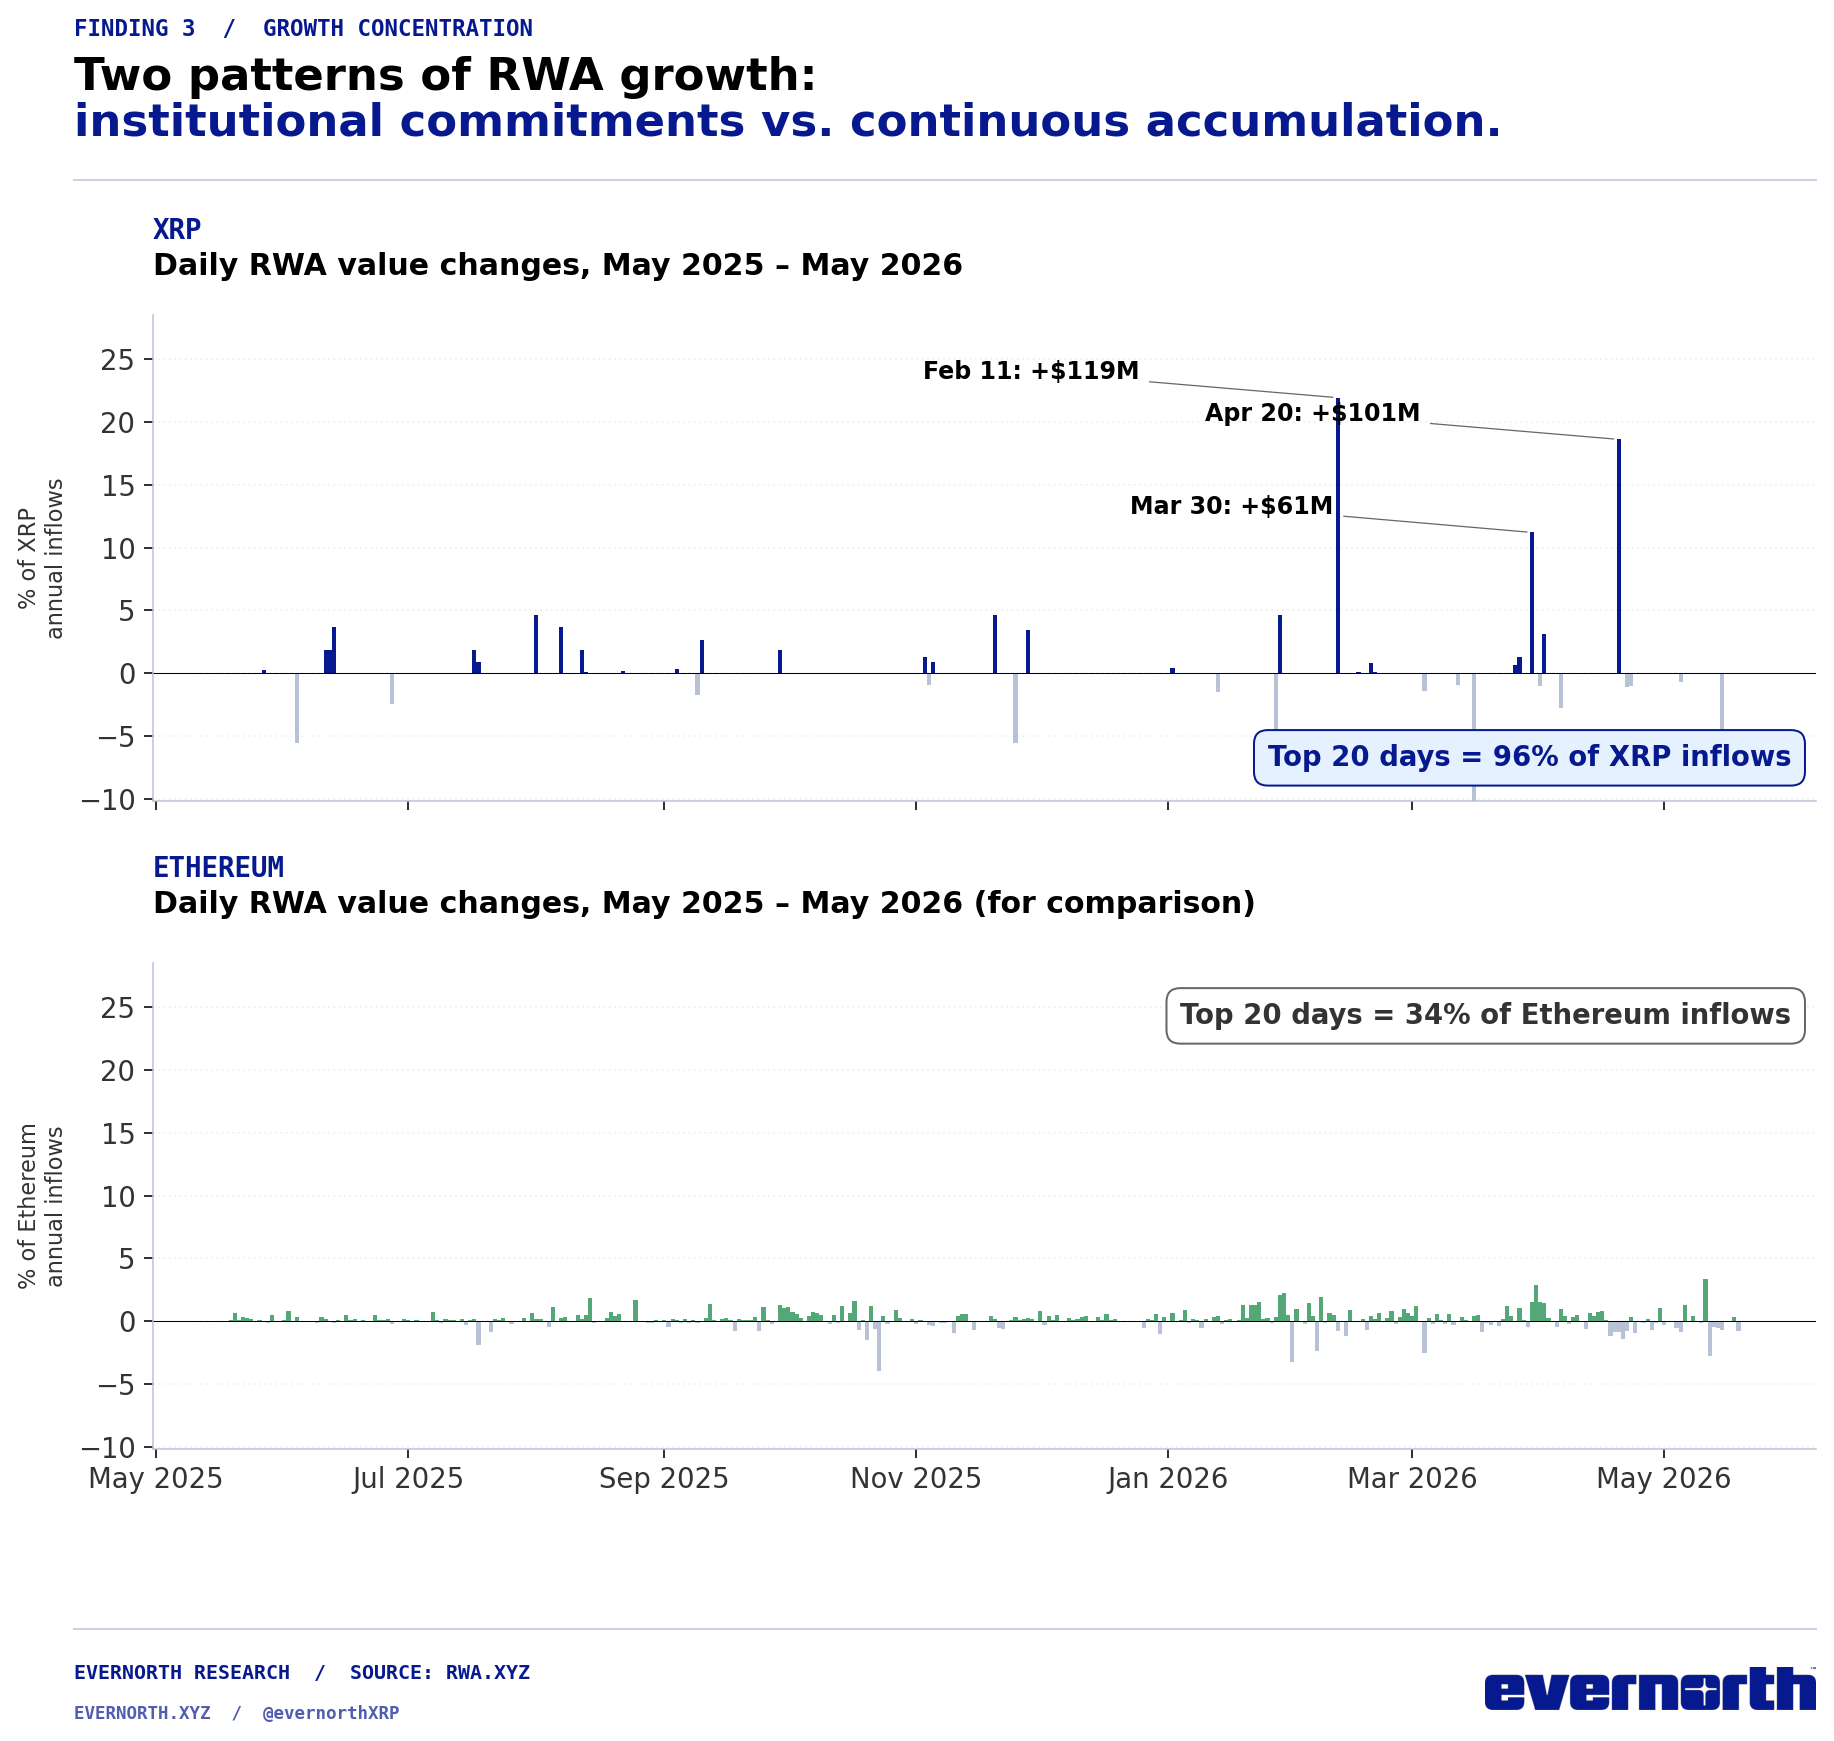
Both panels are drawn to the same scale and both normalized to each chain’s own annual total. The contrast in pattern is the whole point: XRP’s curve is mostly flat with a few enormous step-changes; Ethereum’s curve is a steady, continuous hum.
XRP’s three largest single-day inflows this year were:
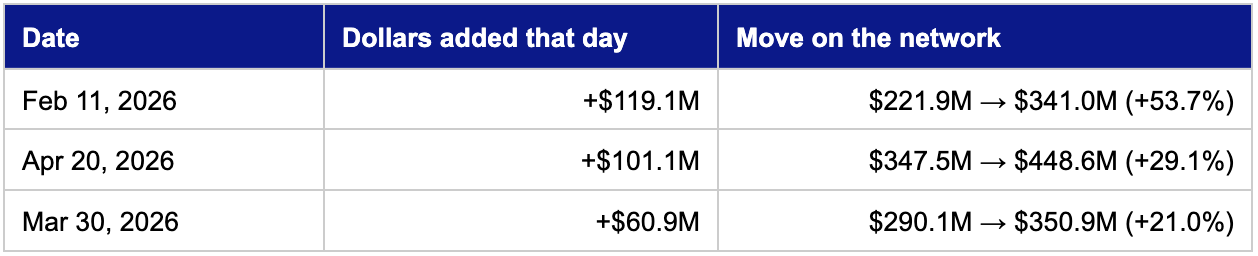
Each of those days is consistent with a single large commitment coming on-chain, rather than an accumulation of smaller positions over time.
So what does this tell us? The growth profile itself is consistent with an issuer base that skews institutional. And because XRP’s growth comes in chunks, the next big chunk is by definition not yet in the data. Each event of that size adds, in a single day, more than most slower-growing chains accumulate in a month.
FINDING 4
The leaderboard among enterprise-focused blockchains has reordered — and XRP has moved up it
A useful test of momentum is to look at how a network ranks against its peer group.
XRP has historically been grouped with chains like Algorand, Mantle, and Aptos, networks positioned for enterprise and institutional tokenization and that began scaling tokenized assets in a comparable window. Looking at where that group sat a year ago versus where it sits today:
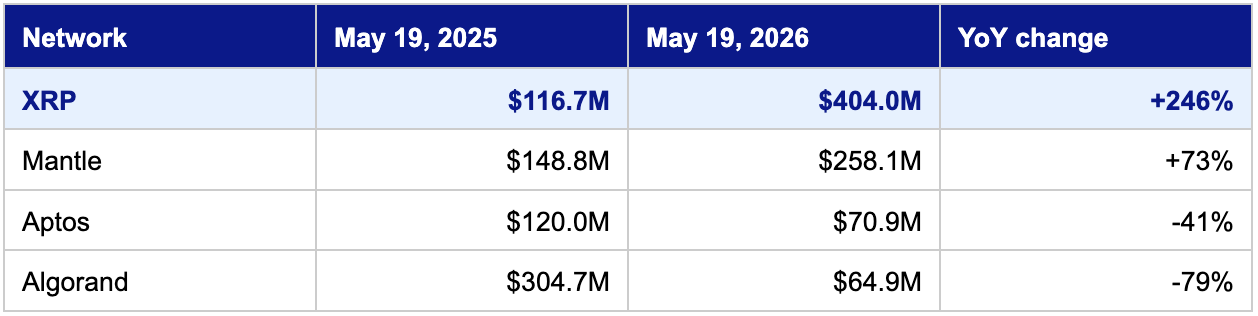
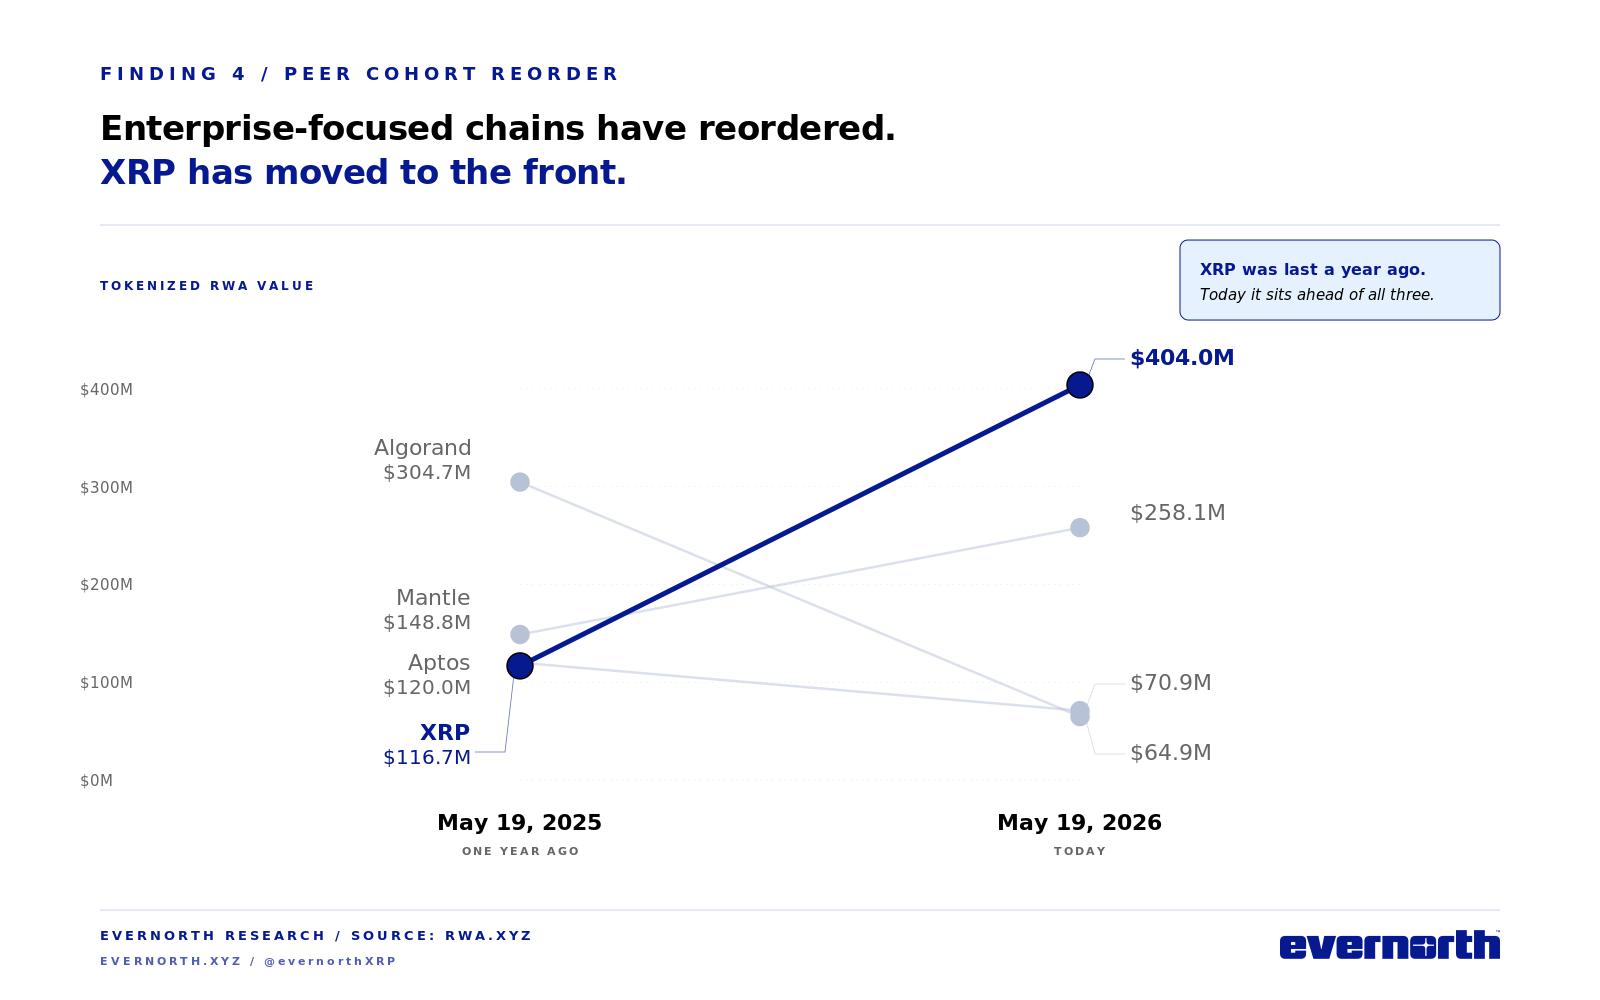
A year ago, all three of those peer networks were ahead of XRP, with Algorand 2.6x larger. Today all three are behind it.
It would be too strong a claim to say issuers picked up their assets from Algorand and re-issued them on XRP (the dataset doesn’t track that level of detail), and the contractions on other chains have many possible causes (asset redemptions, issuer wind-downs, valuation effects). What we can say from the data is this: the kind of issuer activity that once made Algorand a notable tokenization venue has gotten much smaller, while the same kind of activity on XRP has gotten much larger. Whether or not specific dollars moved between them, the relative attractiveness of these chains for tokenization business has clearly shifted.
When new issuance starts consistently choosing one network over another within the same category, that’s typically one of the earliest signals of where long-term mindshare is going.
FINDING 5
From first appearance to $400M in 20 months
XRP’s first measurable RWA datapoint in this dataset was September 10, 2024, at $3.0 million. Twenty months later, it sits at $404 million — a 134x increase from where it started being tracked.
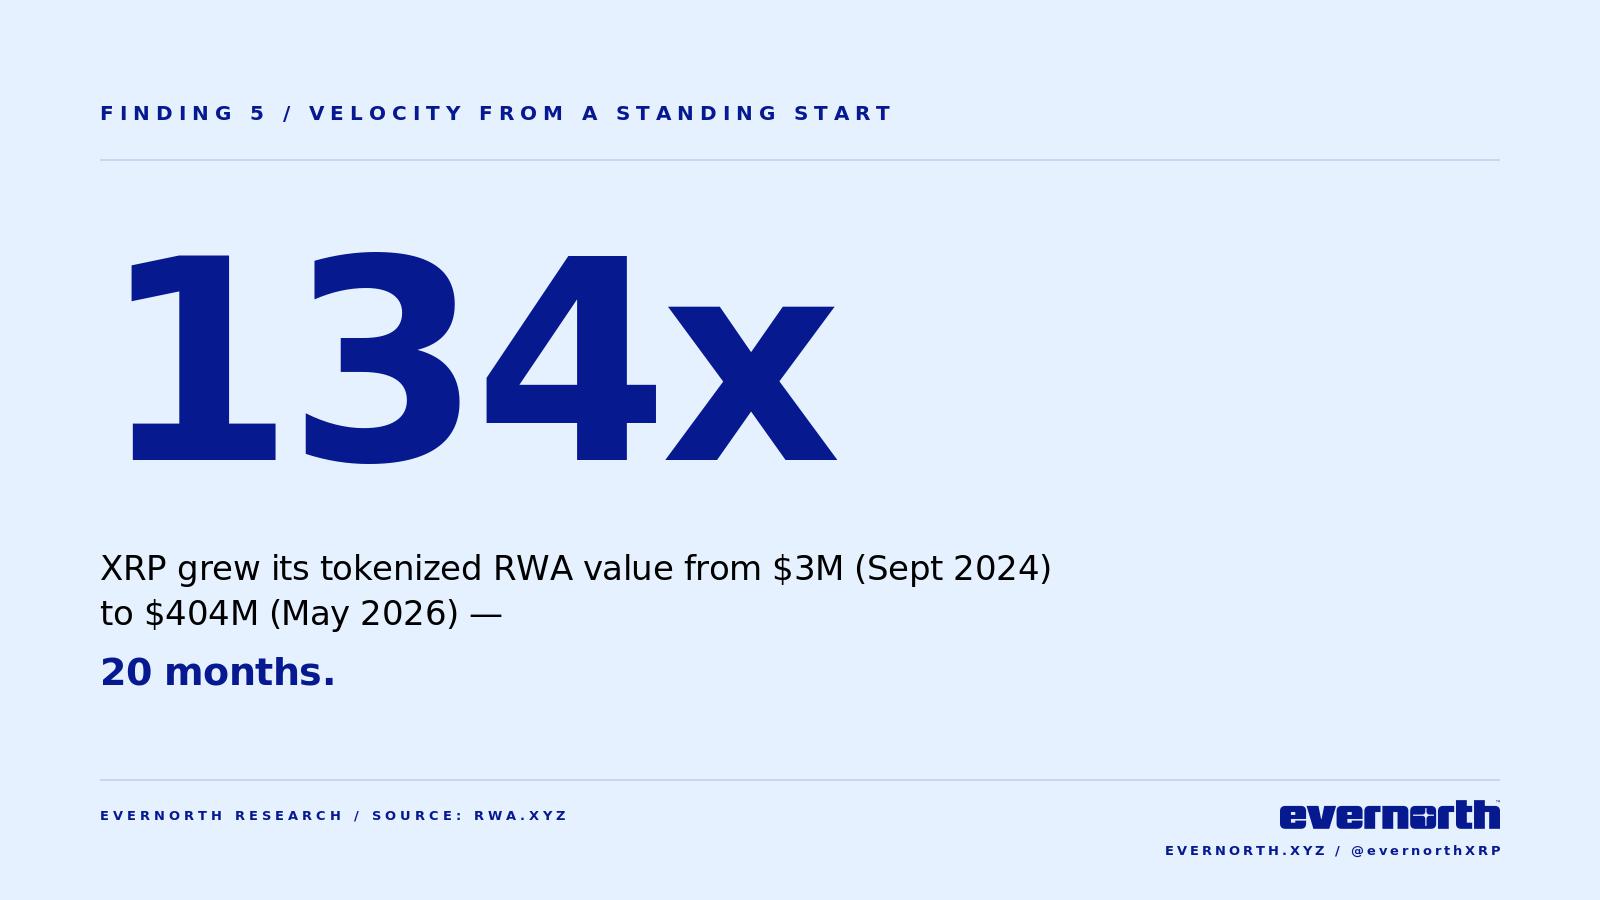
Comparisons to chains with longer histories aren’t quite fair here. Ethereum’s tokenization journey started in 2018, Stellar’s in 2022. But against the cohort of chains where institutional tokenization began materially scaling in roughly the same window (Solana, Avalanche, Arbitrum, zkSync Era, and others that crossed $10M after 2023), XRP has produced the steepest absolute growth curve from a comparable starting point of any infrastructure Layer 1 in the dataset.
The framing matters. "$404M" sounds small next to Ethereum’s $18.7B. "Went from $3M to $404M in twenty months" tells a completely different story, and it’s the story that maps to where the network is heading, not where it currently is.
WHAT IT ALL MEANS
Putting the five findings together
1. XRP is scaling on the same time horizon as the chains currently considered the frontier of tokenization.
2. Its growth rate this year sits in the top tier of established networks, and is more than twice Ethereum’s.
3. The shape of that growth - episodic, treasury-scale commitments rather than retail trickle - is consistent with an institutional issuer base.
4. The chain is gaining ground inside its peer category, with the competitive ordering visibly shifting.
5. Its rise from a small base has been faster than any comparable infrastructure Layer 1.
Anyone relying only on current size to evaluate where the tokenization market is heading is missing a meaningful piece of the picture. The infrastructure that institutional tokenization runs on five years from now is being decided right now, in pilots, partnerships, and platform choices whose effects show up first in the growth data and only later in the rankings. The data above is one input into reading that signal. We expect more of it to surface over the coming quarters.
METHODOLOGY
We took the public dataset that tracks how much real-world asset value lives on each blockchain, looked at how each chain grew over time, and ran a few comparisons designed to surface patterns that current-size rankings miss.
The technical notes: source data is rwa.xyz’s "Bridged Token Value (Dollar)" time series, covering 29 networks from September 24, 2018 through May 19, 2026. Growth rates are calculated against the nearest available date when the exact target date is missing. The growth-concentration metric is the share of trailing-365-day positive daily deltas accounted for by each chain’s top inflow days. The maximum single-day jump is measured only on days where the prior value exceeded $50M, to avoid base-effect distortion. Networks with current value below $200M were excluded from comparative growth tables.
A coverage note: this dataset captures tokenized asset value as classified by rwa.xyz. Some natively-issued products on XRP, including certain large energy-backed tokens reported separately by issuers and press, are not reflected in these figures. The growth rates reported here are therefore the conservative read; the broader picture of tokenization activity on XRP is larger than what the numbers above show.
This post is for informational purposes only. It is not investment advice and is not a recommendation to buy, sell, or hold any security or digital asset. Evernorth Holdings, Inc. is a digital asset treasury company that holds XRP as a core treasury asset and has a direct financial interest in the adoption and value of XRP.
This post contains forward-looking statements within the meaning of the Private Securities Litigation Reform Act of 1995, including statements about market direction, future growth patterns, institutional adoption trends, and the competitive positioning of blockchain networks. These statements are based on current expectations and are subject to risks and uncertainties that could cause actual results to differ materially, including those described in Evernorth's Registration Statement on Form S-4 filed with the SEC. Past growth rates are not indicative of future results. Evernorth undertakes no obligation to update any forward-looking statement. Learn more about Evernorth: https://www.evernorth.xyz/blog-post-03-18-2026